Edge Matrix Validator is live! · Start your 7-day free trial — use code EDGEMATRIX25 for 25% off Try it now →

The Tools Professional Desks Use.
Now On Your Desktop.

Every tab in Edge Matrix is built around one principle: tell you the truth about your strategy, in numbers that hold up under scrutiny — not marketing claims.

01
Universal Importer

Drop in any backtest. We handle the rest.

MT4, MT5, and cTrader strategy tester reports — automatically detected and parsed. Single strategies or multi-strategy portfolios.

🔌

MT4 / MT5 / cTrader Auto-Detection

Drop any HTML strategy tester report — no format conversion needed. Multilingual reports supported.

📚

Portfolio Mode

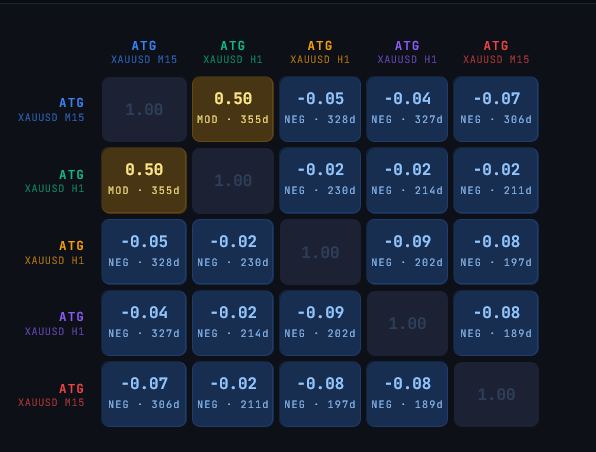
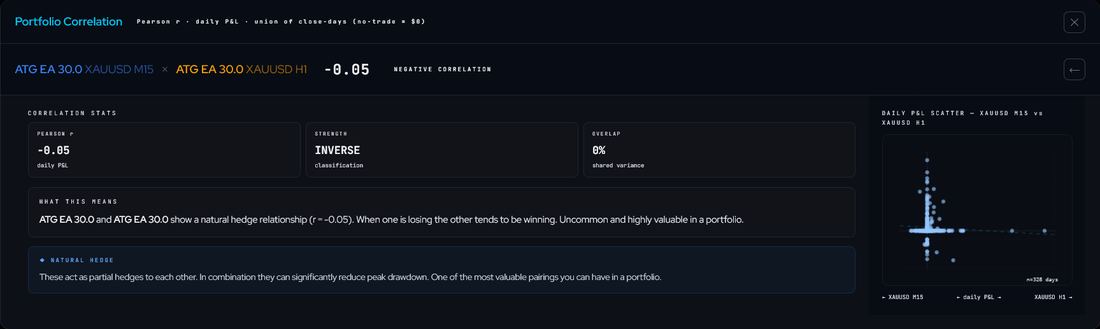
Combine multiple strategies into a single portfolio session. Analyze combined drawdown, session-level interactions, and correlation.

🔍

Smart Trade Extraction

Pulls every closed trade with timestamps, P/L, lot size, symbol, and session — including swap and commission accuracy.

IMPORT DETECTED
FormatMT5 HTML
StrategyAIT Pro v3.2
SymbolUS30 / H1
Trades1,204
Period2020-06 → 2026-04
Net P/L+$24,984.74
02
Backtest Period Science

How long should your backtest actually be?

The Analysis tab uses regime detection and academic research to calculate the optimal backtest period for your strategy. Then projects forward equity paths with full confidence intervals — so you see the realistic range, not just the lucky one.

🗓️

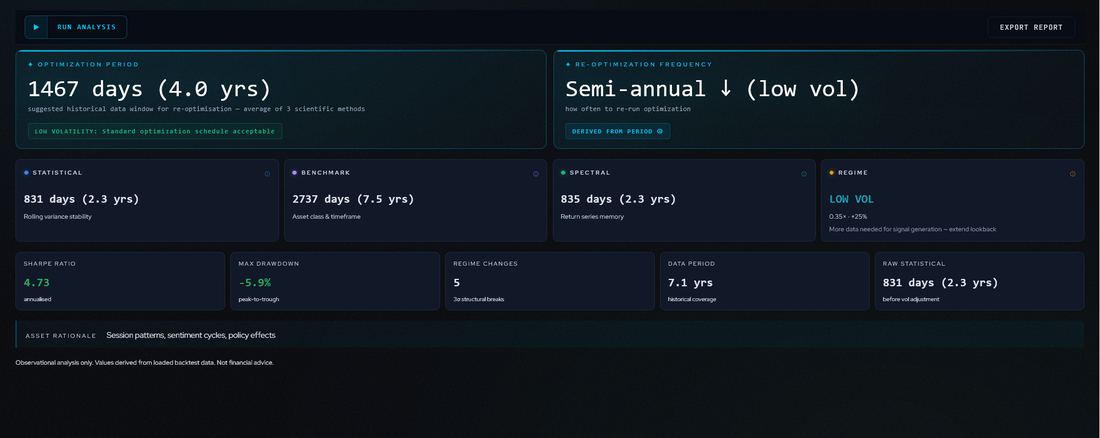
Optimal Period Calculation

Algorithm-driven recommendation based on volatility regimes, sample-size sufficiency, and strategy turnover. No more arbitrary "use 5 years" rules.

📈

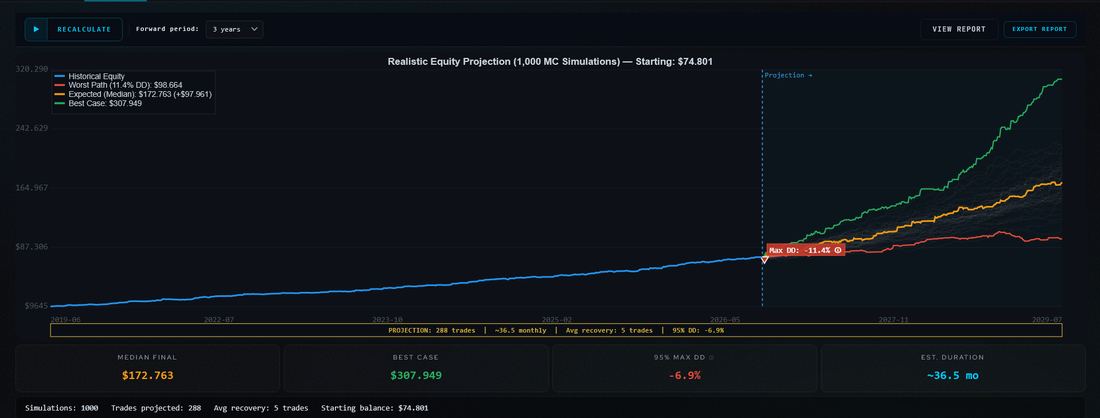
Forward Equity Projection

1,000+ simulated paths with median, 50th, 95th, and 99th percentile equity curves. See your realistic best, worst, and median outcomes.

🔄

Regime Change Detection

Identifies 3σ structural breaks in your equity curve where market behavior shifted. Critical for knowing if old performance still applies.

🎯

Walk-Forward Guidance

In-sample / out-of-sample split recommendations and re-optimization frequency suggestions, tuned to your strategy's signature.

OPTIMIZATION ANALYSIS
Recommended Period3.6 – 5.5 Years
Trades Available1,204 ✓ Sufficient
Regime Changes6 Detected
Re-Optimize Every~9 Months
Projected (Median)+$8,420 / 12mo
95% Max DD-23.5%
03
Stress Testing

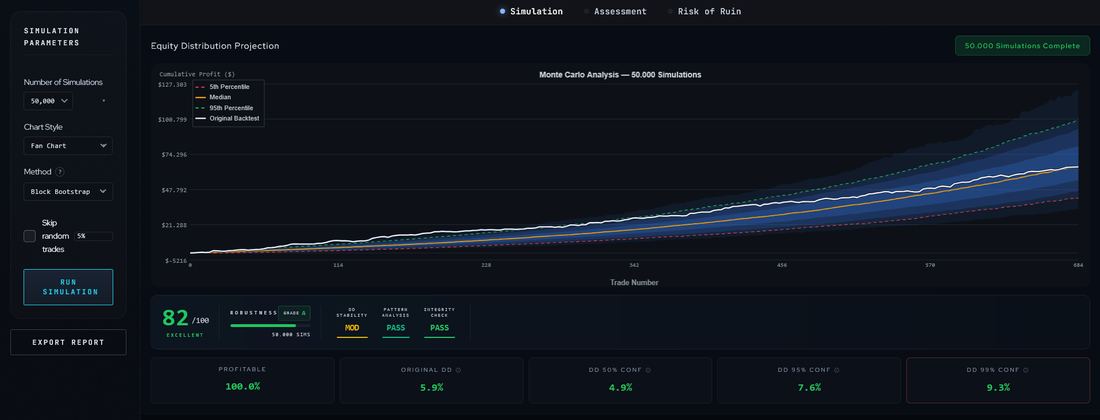
Stress test your equity curve against 50,000 alternate realities.

Bootstrap, permutation, block bootstrap, and trade-skipping simulations reveal what your backtest looked like only because of luck. Get drawdown confidence intervals, risk-of-ruin estimates, and a Monte Carlo assessment in plain English.

🔀

Bootstrap & Permutation

Shuffle existing trades or resample with replacement. Each method reveals different fragilities in your strategy.

🧱

Block Bootstrap

Losing trades rarely arrive one at a time. Block bootstrap resamples short runs of consecutive trades, so clusters that occurred in your history could occur again in the simulation. Run length is estimated from your own trades using the Politis-White procedure rather than a fixed setting, and it is reported with the result. When a strategy showed no clustering the run length fell to about one trade and the method described the same thing as ordinary bootstrap, which the report states plainly.

Random Trade Skipping

Simulate missed trades from slippage, spread, or VPS downtime. Configurable 1–10% skip rate.

📊

Confidence Intervals

Maximum drawdown at 50%, 95%, and 99% confidence. Know your realistic worst-case, not just the single lucky path.

💀

Risk of Ruin Calculator

What's the probability of losing 20%, 40%, or your entire account? See it spelled out with statistical backing.

MONTE CARLO ENGINE
SimulationsUp to 50,000
Chart Styles5 Visualization Modes
ResamplingBootstrap + Permutation + Block
Block LengthEstimated From Your Trades
Confidence Levels50% / 95% / 99%
Risk of RuinPath-Dependent Probabilities
MC AssessmentPlain-English Verdict
04
Core Validation

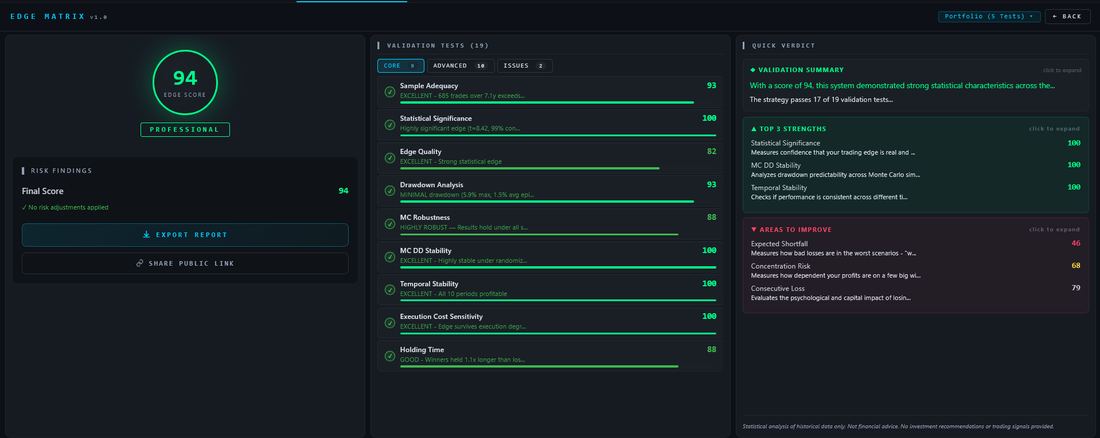
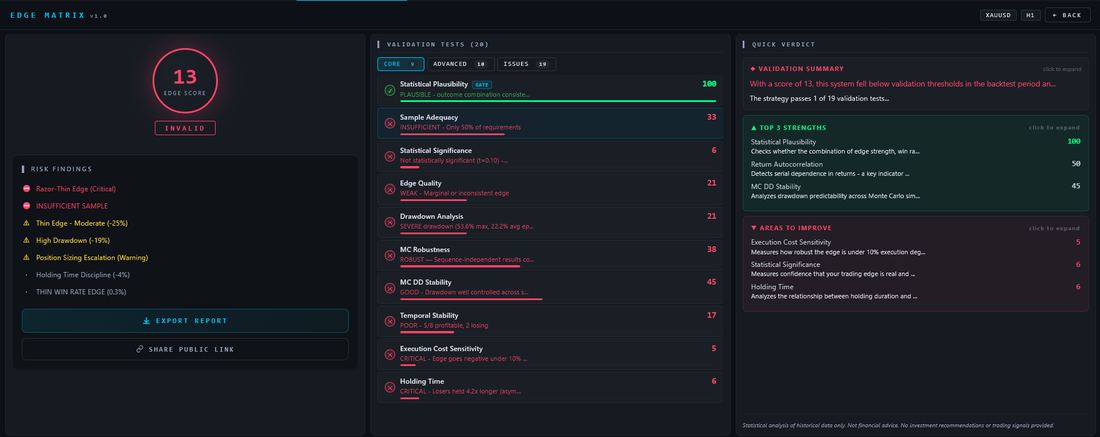
19 institutional-grade validation tests. One score.

Edge Matrix runs 19 statistical tests on every strategy — from Sharpe ratio with sample-size validation to advanced overfitting detection. The output is a single 0–100 score with category breakdowns, so you know exactly where your strategy is strong and where it's fragile.

🧮

Deflated Sharpe Ratio

Corrects raw Sharpe for the multiple-trials bias common in parameter optimization. Built on Bailey & López de Prado's framework.

DD Endurance / Triple Penance

Bailey & López de Prado's rule for how long an investor must wait through max drawdown before rationally concluding a strategy is broken.

🌊

Tail Risk (CVaR)

Expected shortfall in the worst 5% of outcomes — the Basel III standard for risk measurement. Far more informative than VaR alone.

🎯

Pattern Detection

Martingale, grid, hold-time asymmetry, skewness, kurtosis, concentration risk (Gini). Catches dangerous patterns hiding behind smooth curves.

87.4
EDGE SCORE · ROBUST TIER
Profitability
92
Risk Mgmt
85
Statistical Edge
78
Consistency
90
Recovery
88
05
Pattern Analysis

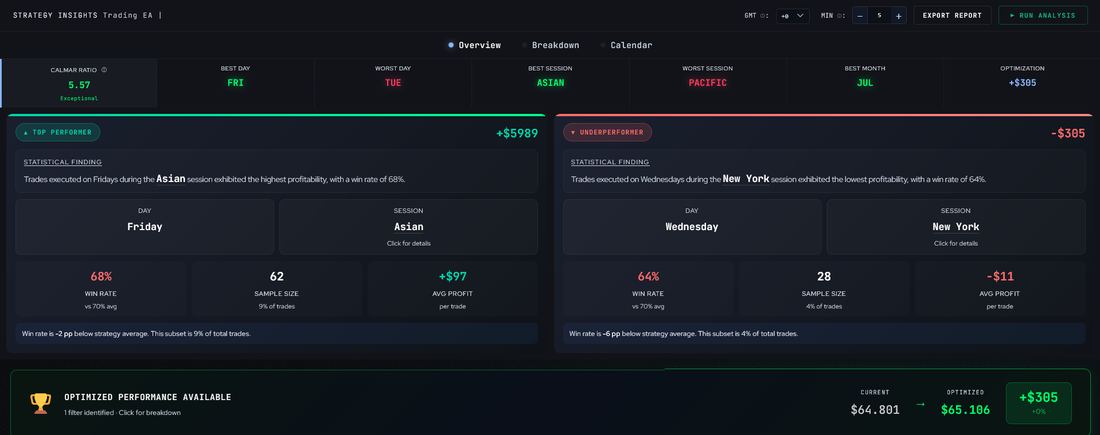
Find the money you're leaving on the table.

Insights breaks your trade history down by day, session, month, and symbol — then identifies losing patterns you can filter out. Get the exact MQL5/MT5/cTrader code to add to your EA, with timezone awareness.

📅

Day / Session / Month Buckets

Pattern detection across Asian, London, NY, and Pacific sessions, plus day-of-week and monthly performance — all with statistical significance testing.

🎚️

Greedy Filter Optimization

Up to 3 optimal filter combinations selected by marginal contribution — preferring broader filters to reduce overfitting.

💻

Platform-Native EA Code

Auto-generated MQL4, MQL5, or cTrader (C#) filter code — drop it directly into your EA. Detects platform from the uploaded backtest.

🌍

GMT / Timezone Adjustment

Set your broker's GMT offset and Insights rebuckets sessions automatically. Critical for getting accurate "NY session" classification.

OPTIMIZATION SUGGESTIONS
TIME FILTER+$650
Step 1: Skip Monday + New York combo
MT5 / EA CODE
MqlDateTime _dt; TimeCurrent(_dt);
if(_dt.day_of_week == 1 && _dt.hour >= 16 && _dt.hour < 21) return;
TIME FILTER+$441
Step 2: Skip Friday afternoon NY
TOTAL IMPROVEMENT: +$1,091 (+4%)
06
Multi-Strategy

Compare up to 20 strategies side by side.

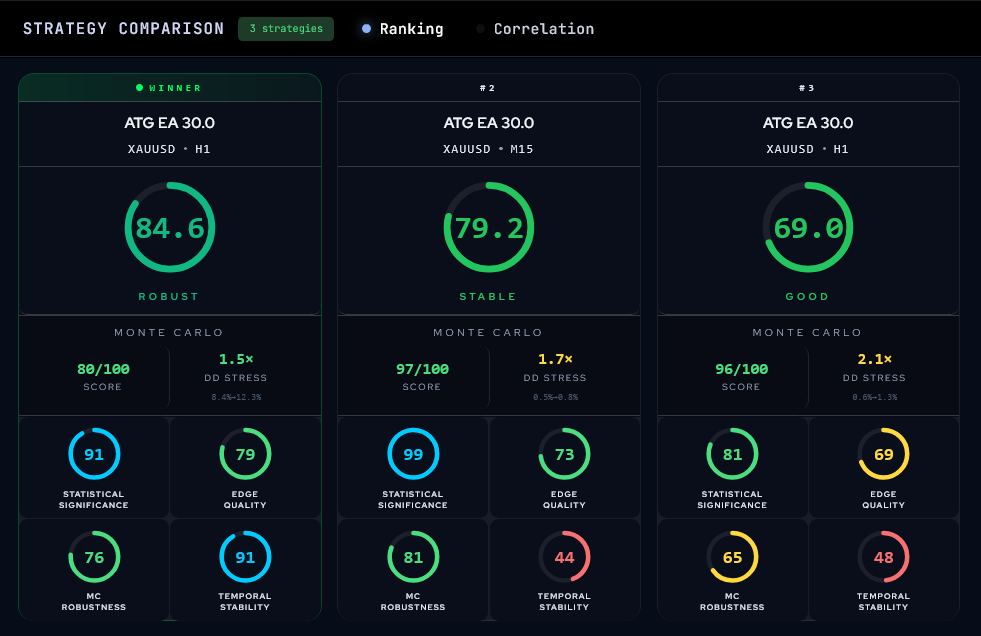
Rank your strategies on every metric in one view. See which wins on risk, which wins on consistency, which to drop — backed by Monte Carlo robustness scores and Edge Matrix totals.

⚔️

Head-to-Head Ranking

Net P/L, Sharpe, drawdown, profit factor, recovery factor, and 15+ other metrics ranked side by side with color-coded winners and losers.

🔬

Cross-Strategy Monte Carlo

Each strategy stress-tested independently, then ranked by Monte Carlo robustness score. The best backtest doesn't always survive.

🏆

Composite Verdict

Per-strategy Edge Score plus pro/con summary — at a glance you know which strategies are worth pursuing and which to retire.

5-STRATEGY COMPARISON
StrategySharpeMax DDEdge
Apex EA v62.41-14.2%87.4
Imperium1.92-9.8%79.1
ATG cBot1.65-18.4%74.3
Viking EA1.31-22.7%68.9
Mean Rev Pro0.78-34.1%52.4
07
Documentation

Publication-ready HTML reports.

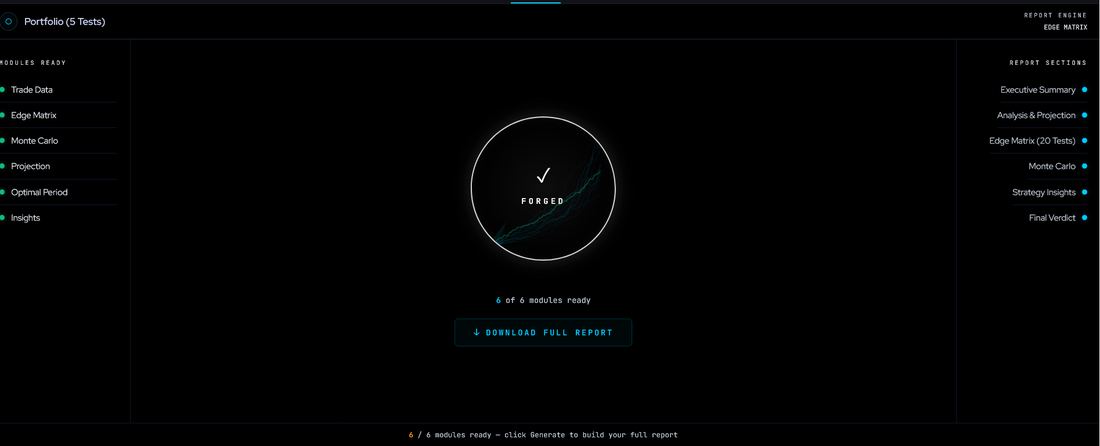
Every analysis you run can be exported as a professional, self-contained HTML report — full methodology, every chart, academic citations, and complete numerical detail. Share with clients, prop firms, or save for your own records.

📄

Self-Contained HTML

Interactive HTML reports — open in any browser, no internet required. Charts render natively. Save and share without dependencies.

📚

Methodology & Citations

Every test references the academic work behind it — López de Prado, Bailey, Sharpe, Calmar. Investor-defensible documentation.

🎯

Customizable Sections

Include only what you need — Edge Matrix, Monte Carlo, Insights, Projection, or all of it. Reports adapt to what you've run.

🖨️

Print-Friendly

Open the HTML report and print to PDF from your browser if you need a paper copy or a static archive.

REPORT SECTIONS
Executive Summary
Analysis & Projection
Monte Carlo Stress Test
Edge Matrix Score (19 tests)
Insights & Optimization
Methodology & Citations
Verdict & Recommendations

Try parts of the engine for free.

▸ FREE TOOL #1

Monte Carlo Simulator

Run a simplified Monte Carlo simulation on any MT4/MT5/cTrader backtest. Confidence intervals, bootstrap resampling, drawdown distribution. The same engine that powers Edge Matrix, in lightweight form.

Try Free Monte Carlo →
▸ FREE TOOL #2

Backtest Graph Builder

Drop in any MT4/MT5/cTrader report — get equity curve, drawdown chart, monthly P/L, and per-trade scatter. Runs in your browser, your data never leaves your device.

Try Graph Builder →

Everything Else

🌍

Multilingual Parser

MT4/MT5 reports parsed in any language — automatic detection of trade columns regardless of broker locale.

🔐

Your Data Stays Yours

Sessions stored only as long as you need them. Free tools run entirely in-browser. No backtest data is shared or sold, ever.

Cloud-Powered Engine

Heavy compute (50K Monte Carlo, 19-test validation) runs on dedicated cloud infrastructure. No CPU strain on your machine.

📚

Academic Foundations

Methodology built on peer-reviewed research from López de Prado, Bailey, Sharpe, Sortino, Calmar — not marketing claims.

🚀

7-Day Free Trial

Full Pro access for 7 days. No charge if you cancel before day 8. Card on file — auto-billed when trial ends unless cancelled.

💎

Lifetime Option

One-time payment unlocks all current and future features. No subscription, no upsells, no surprises.

Recent Updates

Actively built. Shipped regularly.

Edge Matrix is in continuous development. Recent improvements, in plain language — no version-number noise.

NEW

Live and demo account reports

Edge Matrix now read live and demo account statements, not only strategy tester backtests. MT4 account statements and MT5 trade history were parsed directly, with deposits, withdrawals, and transfers separated from the trading. For an account funded over time, performance was reconstructed against the balance that was actually at risk on each trade, so drawdown and returns matched how a broker or a track-record service reported the same account rather than assuming all the capital was present from day one. The dashboard showed absolute gain, the true maximum drawdown, and the time-weighted return. The full statistical suite ran unchanged, and the integrity checks stayed active, since a statement could be incomplete or unrepresentative just as a backtest could. Report wording adapted to the loaded account history instead of referring to a backtest.

NEW

Monte Carlo method comparison

The Monte Carlo tab now lets you choose your resampling method — Bootstrap (resample with replacement), Permutation (reorder, no replacement), or both side by side. "Both Methods" ran the same backtest under identical settings and compared the results, which isolated how much the robustness score depended on the method rather than the strategy. The exported report included the full comparison, with a separate robustness grade for each method.

NEW

Hide EA name

A new eye toggle in the tab bar replaced your strategy's real name with an anonymous code everywhere — across all tabs, reports, and download filenames. Set it before loading and the name never appeared on screen, which suited sharing screenshots or recording videos without revealing the strategy.

IMPROVED

More faithful statistical resampling

Projections moved to block-bootstrap resampling, which preserved winning and losing streaks instead of treating each trade as independent. Confidence intervals were added on key metrics, so the numbers reflected how returns actually clustered rather than an idealized random walk.

FIXED

Honest timelines for lower-frequency strategies

Corrected how trading days were pooled, which had compressed the timeline for strategies that trade less often. Projections then spanned the full backtest date range honestly instead of overstating activity.

FIXED

Readability and interface polish

Cleared up faint or hard-to-read labels in several panels, aligned scrollbars to the app's theme, and tidied a range of small interface details across the tabs.

Stop guessing. Start validating.

7-day free trial. Cancel anytime before day 8. Or pay once with Lifetime — yours forever.

View Pricing → Try Free Tool
Risk Disclosure

Edge Matrix is a statistical analysis tool. It evaluates historical backtest data using quantitative methods but does not predict future performance or provide investment advice. Edge Matrix does not recommend whether to deploy, modify, or discontinue any trading strategy. All trading involves substantial risk, including the risk of loss. Past performance, whether analyzed or validated, is not indicative of future results. Users are solely responsible for their trading and investment decisions.

Trading foreign exchange carries a high level of risk that may not be suitable for all investors. Past performance is not indicative of future results. The high degree of leverage can work against you as well as for you.