Edge Matrix Validator is live! · Try the full app free — advanced tests, Monte Carlo, 8 exportable reports. No card required. Try it now →
For developers and advanced traders

Six ways to find out
what a backtest is hiding

A backtest is one path through one sequence of trades. Edge Matrix takes that path apart from six angles, each answering a question the equity curve cannot answer on its own.

What follows is what each tool does and when it earned its place in a workflow. The methods are named and the papers are cited. The parameter choices and scoring weights are not published.

01 · Monte Carlo

Your drawdown was one draw, not the drawdown

The maximum drawdown in a backtest is a single realisation. Had the same trades arrived in a different order, it would have been a different number. Monte Carlo rebuilds the equity curve up to 50,000 times to show the distribution that single number came from.

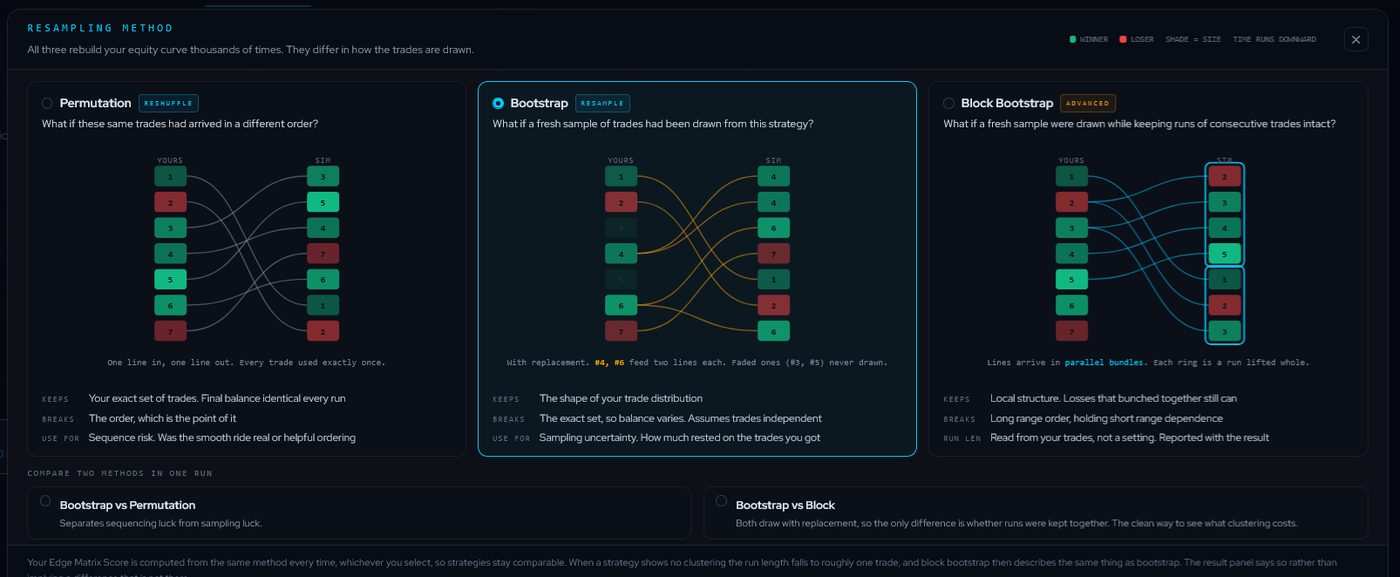
Three methods are available and they differ in how the trades are drawn. Permutation reshuffles your exact set, so the final balance is identical every run and only sequencing changes. Bootstrap draws a fresh sample with replacement, so the balance varies and sampling uncertainty shows up. Block bootstrap also draws with replacement but lifts runs of consecutive trades whole, so losses that bunched together still can.

Two can be run against each other in a single pass. Bootstrap against permutation separates sequencing luck from sampling luck. Bootstrap against block shows what clustering actually cost, since the only difference between them is whether runs were kept together.

Why it matters in development

If the 95th percentile drawdown is well above what the backtest showed, the position sizing that looked survivable was not. Block length is read from your trades rather than set as a parameter, and it is reported with the result. When a strategy shows no clustering the run length falls to roughly one trade and block bootstrap describes the same thing as bootstrap, which the result panel says outright rather than implying a difference that is not there.
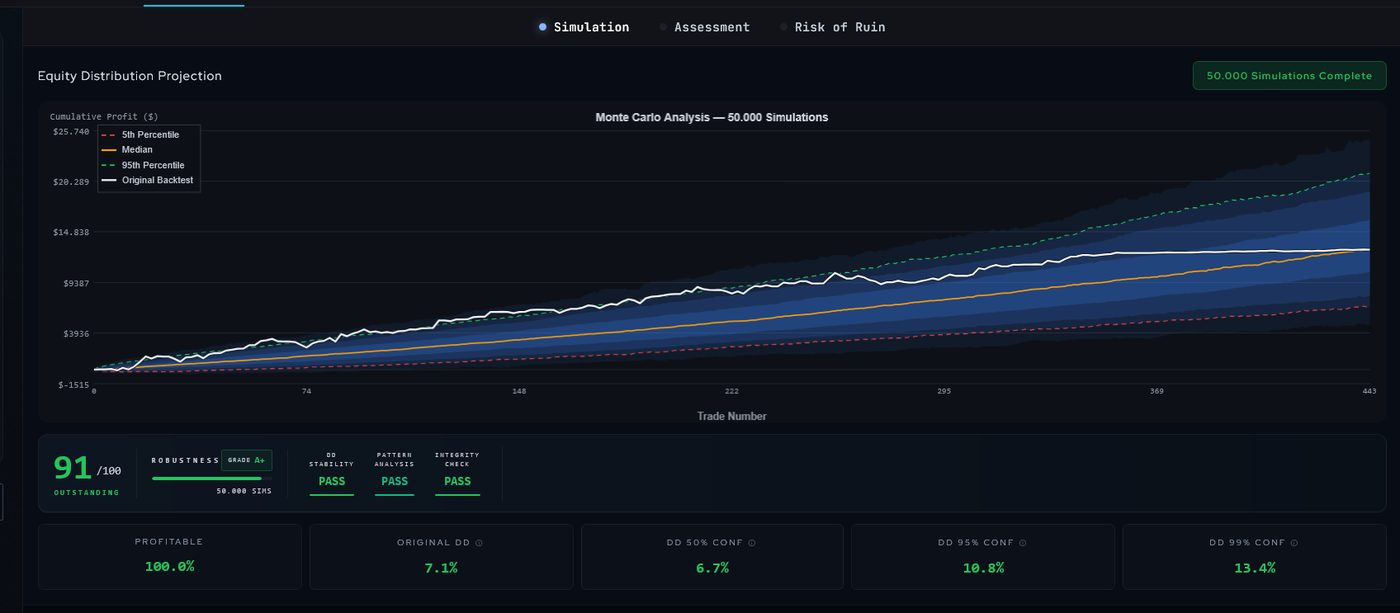
Fan chart · 50,000 simulations
Monte Carlo fan chart, 50,000 simulations, with drawdown confidence levels
Original backtest 95th percentile Median 5th percentile
The three methods, side by side

All three rebuild the equity curve. They differ in how the trades are drawn.

Comparison of permutation, bootstrap and block bootstrap resampling, showing what each keeps and breaks

The selector inside the app. Each method states what it keeps, what it breaks, and what it is useful for.
The Edge Matrix Score is computed from the same method every time regardless of the selection, so strategies stay comparable.

02 · Edge Matrix Score

Nineteen scored tests, and one that can veto them

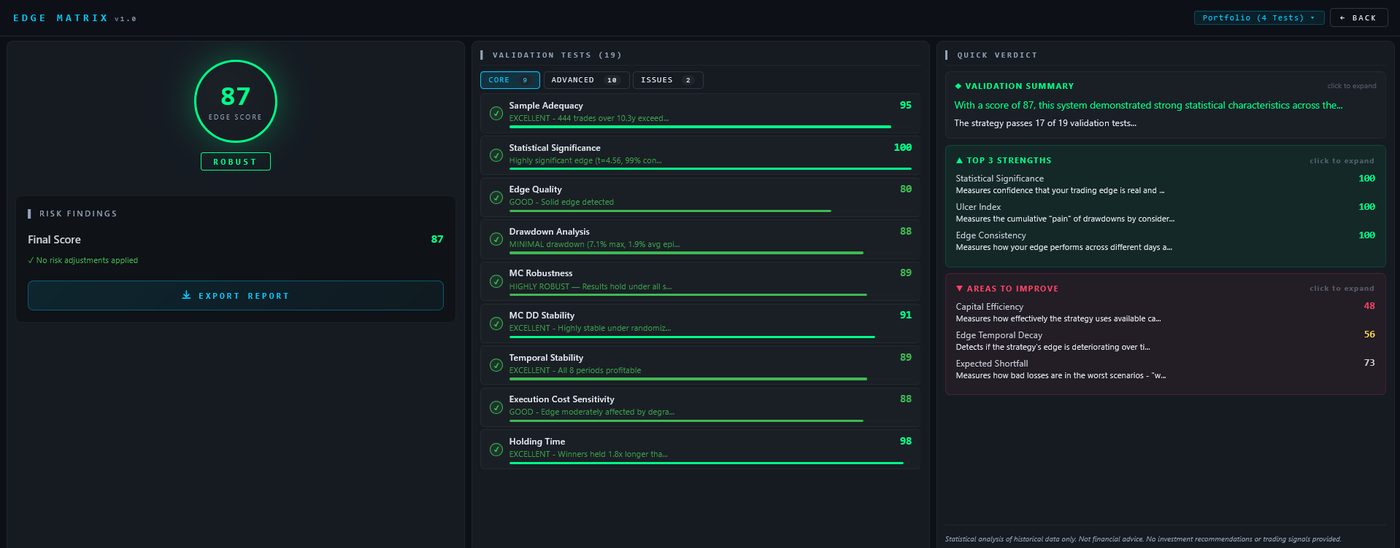
Nineteen statistical tests run against the trade record, split into 9 core and 10 advanced, each returning its own result and its own short verdict rather than disappearing into a single number. The composite score exists for ranking; the individual tests exist for diagnosis.

A twentieth, Statistical Plausibility, behaves differently. It asks whether the combination of win rate, reward-to-risk and trade frequency is consistent with a durable edge at all, and it runs as a gate rather than being averaged in, because a curve that looks smooth everywhere else would otherwise outvote its own detection.

Why it matters in development

An averaged score lets a strategy pass by being mediocre everywhere. Reading the tests individually tells you which assumption broke, which is the part you can act on. The panel surfaces the three strongest and the three weakest directly, so the diagnosis is the first thing on screen rather than something to hunt for.

Validation tests · core 9 / advanced 10
Edge Matrix panel showing the score, the validation test list and the verdict summary
Gate test · not averaged

Statistical Plausibility sits outside the 19 scored tests. Had it failed, the composite would have been capped regardless of the results above.

03 · Insights

Where the losses actually clustered

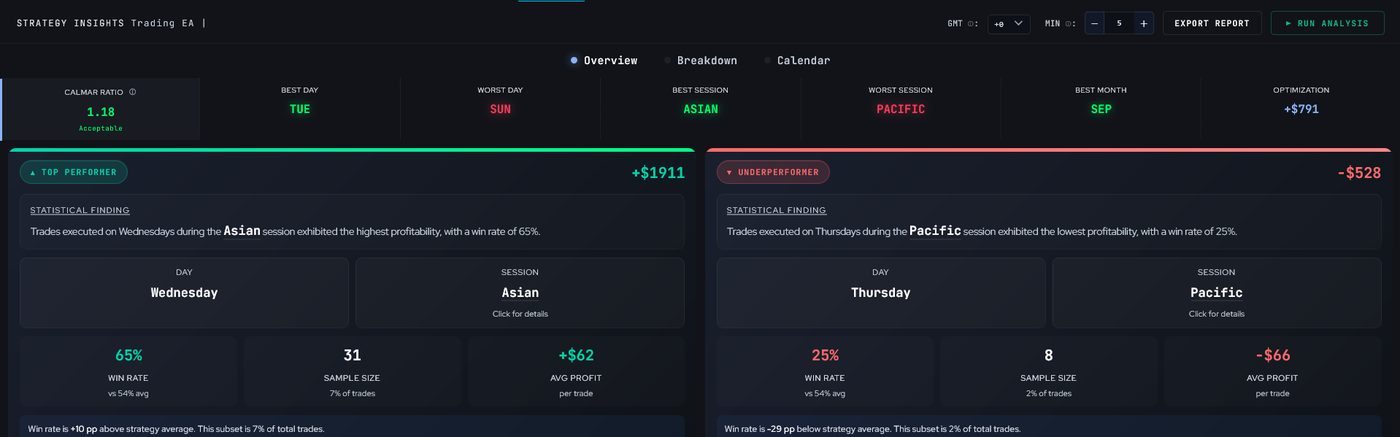
Losses are rarely spread evenly. Insights breaks the trade record down by weekday, session and month, and surfaces the combinations where the strategy lost consistently rather than occasionally.

When a pattern is strong enough to act on, it returns the filter condition in the syntax of the platform the file came from: MQL4, MQL5 or C# for cTrader, detected automatically from the import. It is a condition to drop into your entry logic, not a finished function.

Why it matters in development

This is the fastest path from a diagnosis to a code change. The caution worth holding: every filter you add from in-sample data is another parameter fitted to the past, so the honest move is to re-validate afterwards and expect the score to move.

Net result by session and weekday
Insights overview showing the best and worst day and session combinations
04 · Optimal Period

How often the strategy needed re-optimizing

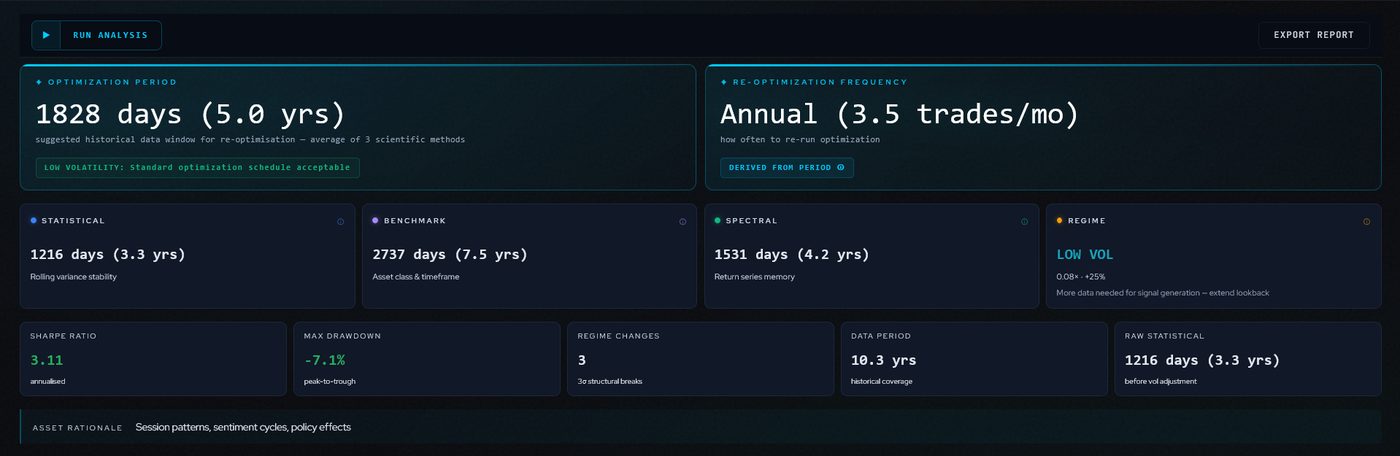
Parameters decay. The question is how fast. Optimal Period estimates the historical data window worth re-optimizing over, and it does so three separate ways rather than one.

Statistical reads rolling variance stability. Benchmark works from asset class and timeframe. Spectral measures memory in the return series. A regime read sits alongside them and adjusts for volatility. Where the three agree, the window is stable. Where they disagree, that disagreement is the finding.

Why it matters in development

Re-optimizing too often fits noise. Too rarely, and you run parameters that stopped describing the market months ago. Most developers pick this interval by habit. This gives a number that came from the strategy's own behaviour instead, and shows the three estimates separately so you can see how much they agreed.

Three methods, then synthesis
Optimal Period showing the suggested window and the three method estimates
05 · Projection

The same trade distribution, extended forward

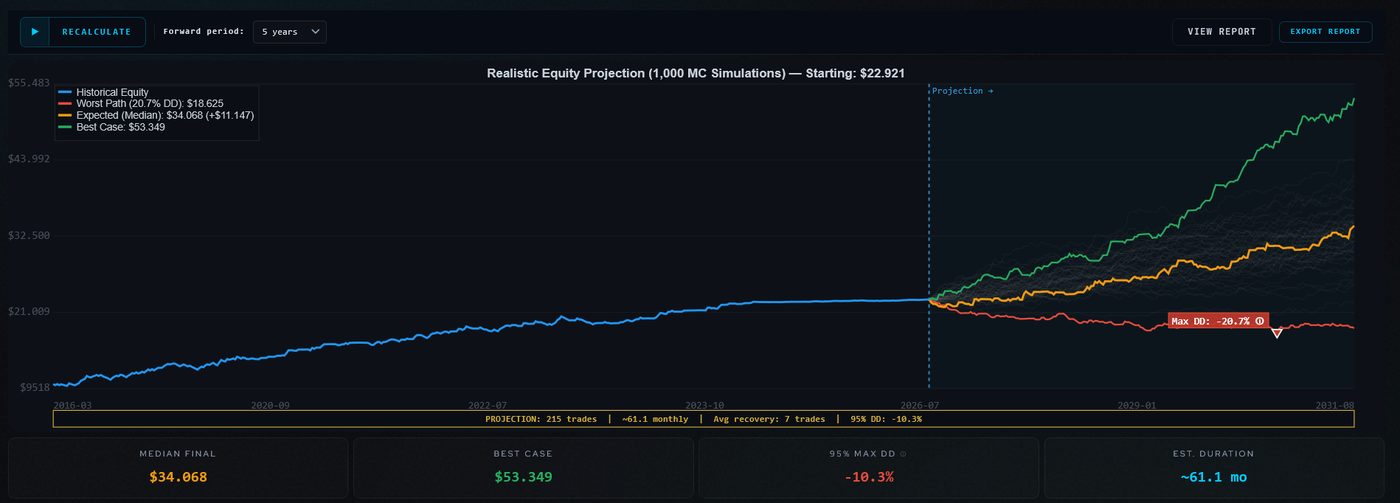
Projection resamples the strategy's own trade distribution over a forward period you choose, and returns a fan rather than a line: a best case, a median, a worst case, and the drawdown you would have needed to sit through to reach each of them.

The resampling preserves streaks rather than treating each trade as independent, so the projected paths cluster losses the way the strategy actually clustered them.

Why it matters in serious trading

Position sizing and capital allocation are decisions about the tail, not the median. A fan tells you what a bad year looked like inside the same statistical process. It is a conditional statement about the past distribution, not a forecast, and it stops being meaningful the moment the market regime that produced those trades ends.

Historical, then projected
Projection showing historical equity then best, median and worst case forward paths
06 · Compare and Portfolio

Four strategies that lose on the same days are one strategy

Compare puts up to ten strategies side by side on the same tests, so the ranking comes from the same measurements rather than from separate reports read in sequence.

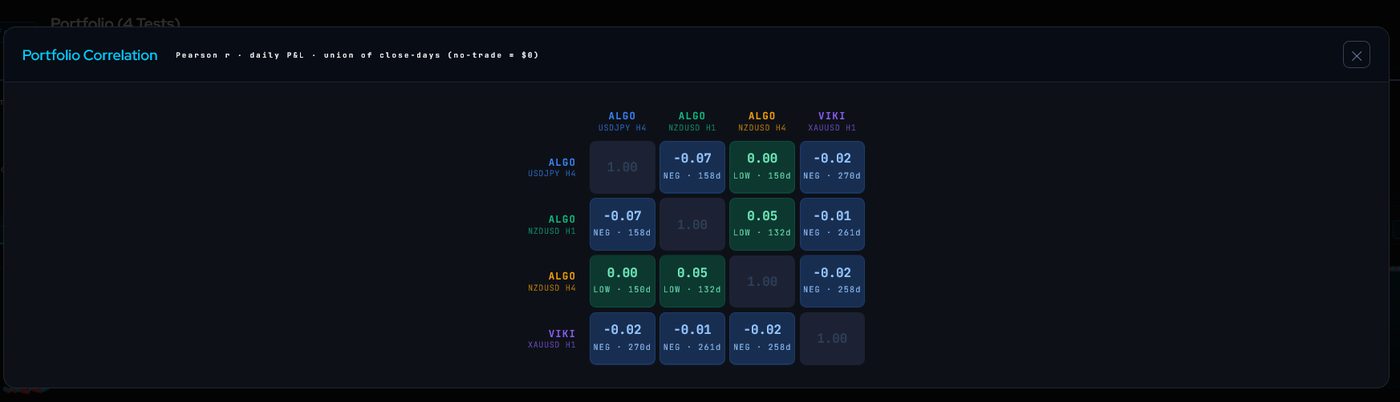
Portfolio Mode goes further and measures how they behave together. Correlation between strategies is the number that decides whether a portfolio diversified anything, and it is invisible when each strategy is validated on its own.

Why it matters in serious trading

Running several EAs on one account feels like diversification. If they trade the same instrument in the same sessions on the same logic family, their drawdowns arrive together and the account behaves like one leveraged strategy. The correlation matrix is where that shows up before the account does.

Cross-strategy correlation
Portfolio correlation matrix across four strategies

What none of this does

  • It does not predict returns. Every figure describes trades that already happened, or resamples of them.
  • It does not tell you whether to run a strategy, and it is not financial advice.
  • A high score means the backtest survived the tests. That is a weaker statement than it sounds, and it stays weaker than a live track record.
  • It cannot see your source code, so it cannot detect look-ahead bias directly, only the statistical fingerprint if one reached the results.
  • Bad tick data produces a confident validation of nothing. The input still matters more than the analysis.

Run it on something you were about to trade

That is the test worth doing. First validation is free and it is the full app on one strategy, not a limited preview.

Start free → Pricing
Risk Disclosure

Edge Matrix is a statistical analysis tool. It evaluates historical backtest data using quantitative methods but does not predict future performance or provide investment advice. Edge Matrix does not recommend whether to deploy, modify, or discontinue any trading strategy. All trading involves substantial risk, including the risk of loss. Past performance, whether analyzed or validated, is not indicative of future results. Users are solely responsible for their trading and investment decisions.

Trading foreign exchange carries a high level of risk that may not be suitable for all investors. Past performance is not indicative of future results. The high degree of leverage can work against you as well as for you.