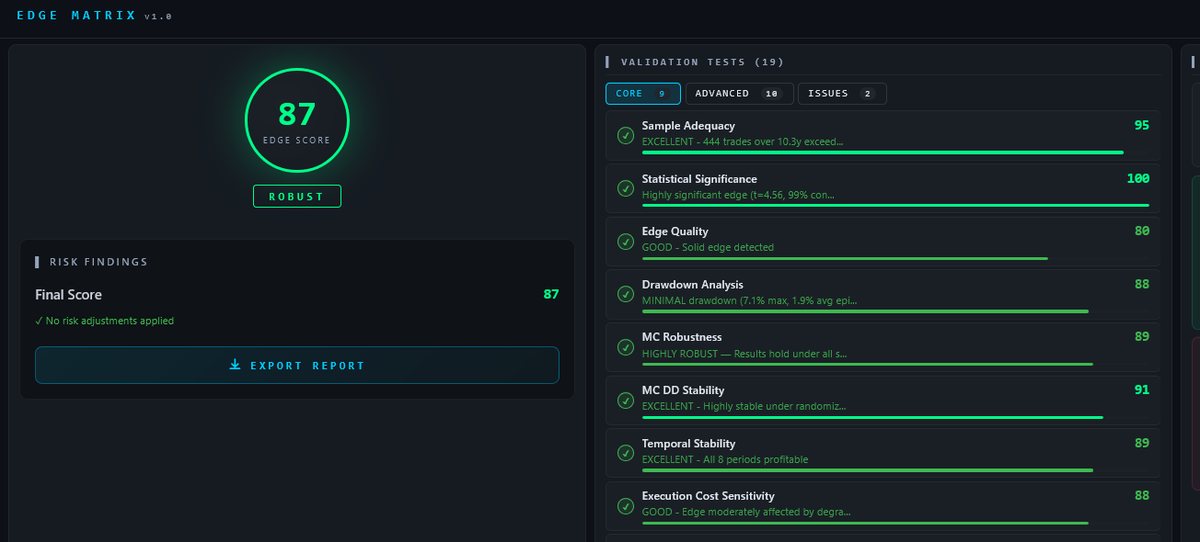
A real result, not a mockup. Nineteen scored tests, each with its own verdict, plus a plausibility gate that sits outside the score.
This one passed 17 of 19. Plenty do not.
The cTrader optimizer finds the parameters that scored best on your data. It does not tell you how much of that score was luck. Edge Matrix takes the strategy tester report and runs 20 statistical tests plus Monte Carlo resampling against it.
It analyses results that already happened. It does not forecast returns and it does not tell you whether to run the bot.
A real result, not a mockup. Nineteen scored tests, each with its own verdict, plus a plausibility gate that sits outside the score.
This one passed 17 of 19. Plenty do not.
cTrader's built-in optimizer is good at what it does. The list below is not a criticism of it. It is a description of where optimization stops and validation starts.
| Capability | cTrader optimizer | Edge Matrix |
|---|---|---|
| Grid and genetic parameter search | yes | no |
| Net profit, drawdown, win rate, Sharpe | yes | yes |
| Custom fitness function | yes | no |
| Monte Carlo resampling of the trade sequence | no | yes |
| Block bootstrap that preserves losing streaks | no | yes |
| Drawdown confidence intervals | no | yes |
| Probabilistic Sharpe and minimum track record length | no | yes |
| Overfitting and implausibility screening | no | yes |
| Multi-strategy correlation and portfolio analysis | no | yes |
| Runs inside the platform, live | yes | no |
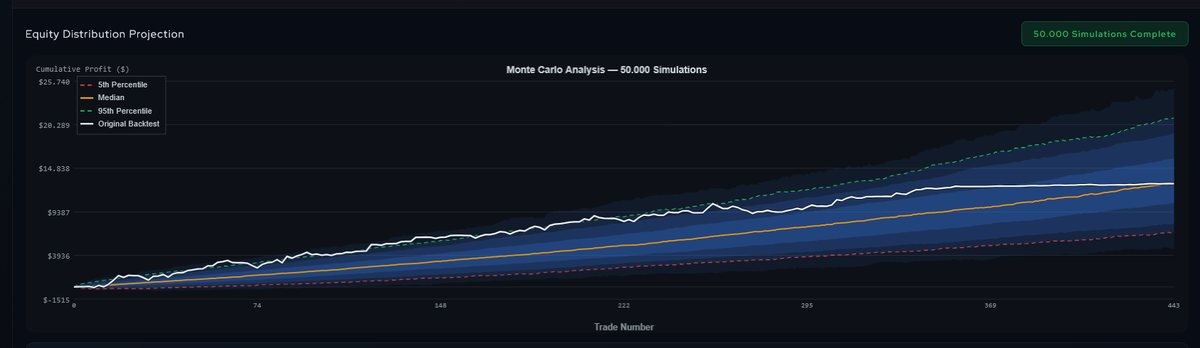
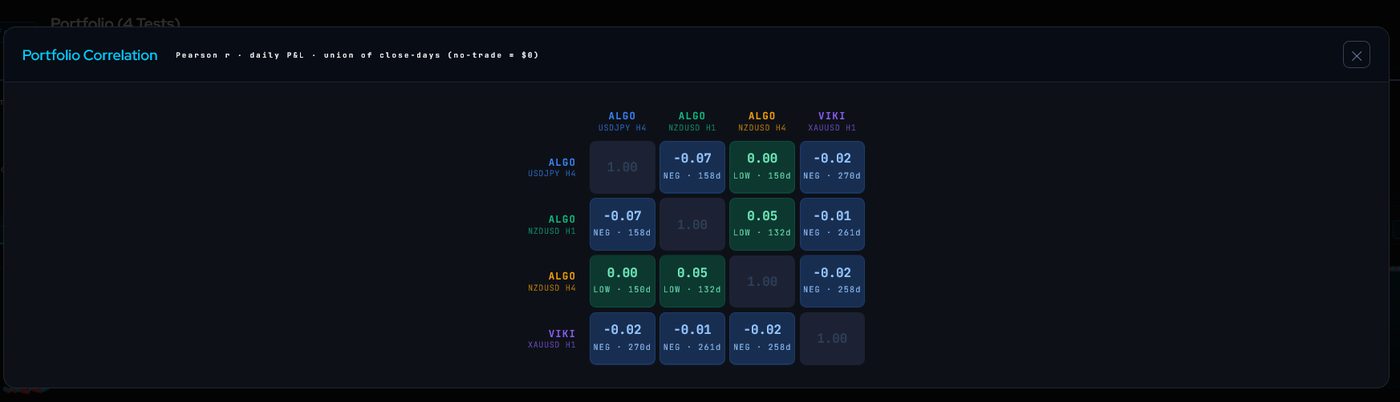
The two rows above that the optimizer cannot fill. Backtest drawdown was 7.1 percent; at the 95th percentile it was 10.8, and at the 99th it was 13.4.
Run your cBot in the cTrader strategy tester, then export the results from the Backtesting tab. Edge Matrix reads the cTrader report format directly, alongside MT4, MT5, MQL5 signals and Myfxbook.
The parser separates deposits and withdrawals from trades, and measures performance against the capital actually at risk on each trade rather than the full starting balance.
Twenty tests, an Edge Matrix Score, a Monte Carlo distribution, and a plain statement of which tests the strategy failed. Sometimes that answer is unfavourable.
The whole process end to end, on an actual strategy rather than a prepared example.
Nothing here is proprietary magic. The references are listed so the implementation can be checked against the paper rather than taken on trust.
Resamples runs of consecutive trades rather than individual ones, so losing streaks and volatility clustering survive into the simulated paths. Mean block length is selected from the data, on squared returns, not set by hand.
Asks whether the combination of win rate, reward-to-risk and trade frequency is consistent with a durable edge at all. Results beyond the bound are flagged as more consistent with overfitting. It runs as a gate rather than being averaged in.
The probability that the observed Sharpe exceeded a benchmark, given the sample length and the higher moments of the return distribution. A high Sharpe on few trades is not the same as a high Sharpe on many.
How many trades would have been needed before the result could be called statistically meaningful, computed from the strategy's own expectancy and moments rather than a rule of thumb.
How long a drawdown could reasonably have run before the underlying assumption of an edge stopped being tenable.
Tail risk measured as CVaR at the Basel III standard rather than VaR alone, plus serial correlation at multiple lags, because a Sharpe of 2.0 with lag-one autocorrelation of 0.3 carried more risk than a Sharpe of 1.5 near zero.
When Insights found that losses concentrated in particular sessions or weekdays, it returned the filter condition. The platform is detected from the imported file, so a cTrader backtest gets C# rather than MQL.
// Drop into your OnTick or OnBar, before entry logic.
if (Server.Time.DayOfWeek == DayOfWeek.Monday && Server.Time.Hour >= 16 && Server.Time.Hour < 21) return;
A condition, not a finished method. The same feature emits MQL4 and MQL5 when the file came from MetaTrader. The hours above are illustrative and describe one backtest's loss distribution, not a recommendation.
That is the useful test. Take a strategy you were about to run live, and see whether the numbers hold up. Validations start at $2.50, one-time, no subscription required.
Validate free → See pricing